Debugging, an essential process for identifying and rectifying errors in a computer program, is particularly crucial for computational biologists dealing with complex codebases that often involve intricate mathematical models, data analysis, and simulations. Merely reading the code may not suffice to grasp the logic and functionality of the project. To gain a deeper understanding, you may need to run the code, examine the variables, and observe the outputs. Towards this end, the integrated debuggers in PyCharm and VSCode prove invaluable.
PyCharm: A Robust and Feature-Rich IDE
PyCharm, a dedicated Python IDE, comes in two editions: Professional (paid) and Community (free and open-source). While most debugging features are available in both editions, some advanced features, such as remote debugging, are exclusive to the Professional Edition.
One of PyCharm’s key strengths lies in its intuitive variable viewer, providing real-time insights into values, types, shapes, and contents of variables. Additionally, the viewer allows for the modification of variables, facilitating the testing of various scenarios.
Inline debugging is another useful feature of PyCharm, displaying variable values next to code lines without the need to hover over them or switch to the debugger window. This saves time and enhances code readability.
Expressions can be evaluated in the debugger window, editor, or console. The Quick Evaluate Expression feature allows the evaluation of any expression under the caret, while the Evaluate Expression dialog executes arbitrary code in the context of the current frame.
The built-in refactoring features are unparalleled, leveraging the intelligence embedded in the IDE to identify opportunities for improving and enhancing code quality and maintenance.
The ability to step through the logic of the codebase without inserting breakpoints at every line is an essential feature. I use it consistently whenever I approach an unfamiliar codebase.
To add a configuration file in PyCharm, head to the ‘Run/Debug menu’ and choose ‘Edit Configurations’. Here, details such as the main.py script in the package and any arguments can be specified.
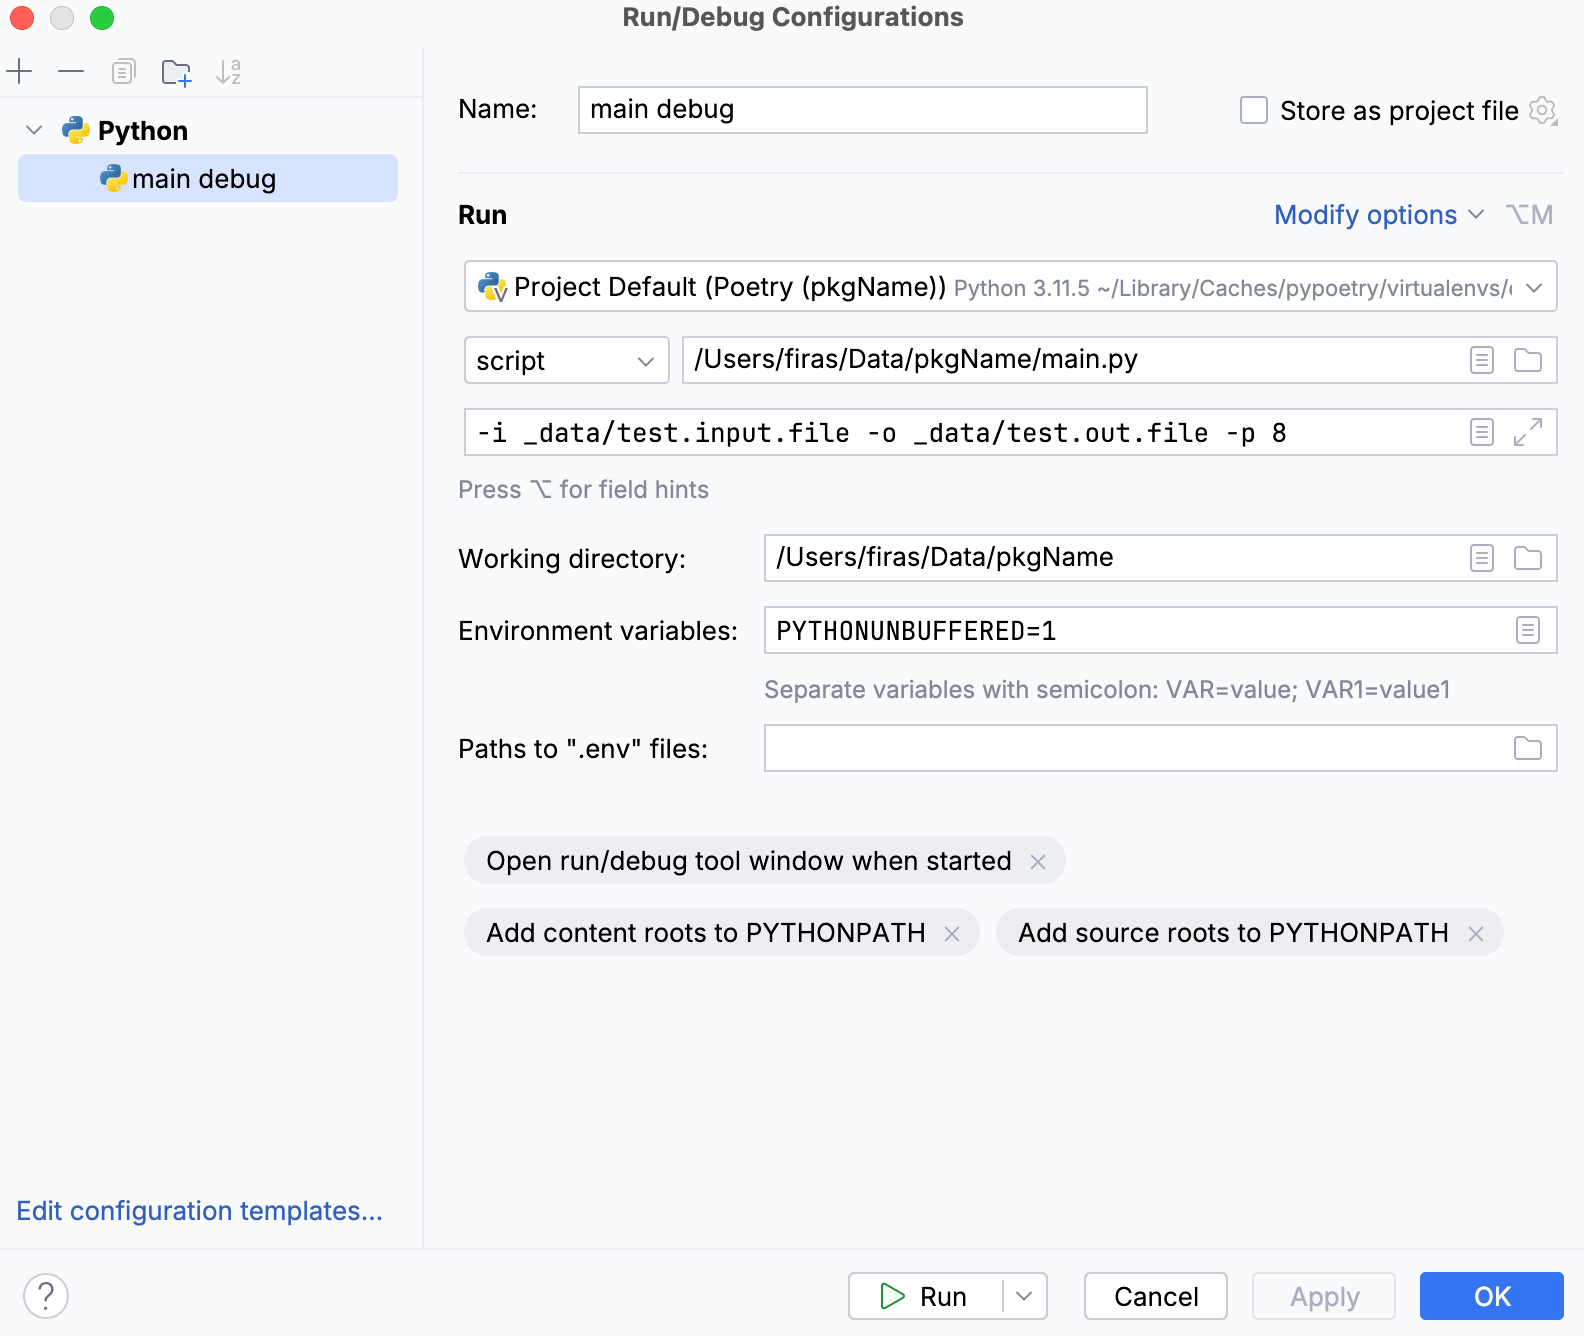
PyCharm also recognises Poetry virtual environments automatically and can install or update packages within the virtual environment as required.
However, PyCharm has its drawback, as it can be resource-intensive, consuming significant memory and CPU power, potentially affecting system performance and battery life (based on my experience with Apple Silicon).
VSCode: A Lightweight and Cost-Effective IDE
VSCode, a versatile and free IDE with a large community, supports multiple languages, including Python. While lacking some advanced features present in PyCharm, VSCode’s lightweight design and quick performance make it ideal for small to medium-sized projects.
To debug Python code in VSCode, install the Python extension, which provides various features and tools for Python development, including debugging. A launch.json file must be created, containing debugger configurations. This file can be generated by clicking on the ‘Debug icon’ in the ‘Activity Bar’, then clicking on the gear icon to open the ‘Debug Configuration’ menu. Choose the Python option, and VSCode will generate a default launch.json file, which can be modified according to needs, specifying script path, arguments, environment variables, and console type.
 1{
 2    // Use IntelliSense to learn about possible attributes.
 3    // Hover to view descriptions of existing attributes.
 4    // For more information, visit: https://go.microsoft.com/fwlink/?linkid=830387
 5    "version": "0.2.0",
 6    "configurations": [
 7        {
 8            "name": "pkgName debug",
 9            "type": "debugpy",
10            "request": "launch",
11            "program": "src/pkgName/main.py",
12            "console": "integratedTerminal",
13            "justMyCode": true,
14            "cwd": "${workspaceFolder}",
15            "args": [
16                "-i",
17                "_data/test.input.file",
18                "-o",
19                "_data/test.out.file",
20                "-p",
21                "8"
22            ]
23        }
24    ]
25}
As I use Poetry to manage my virtual Python environments, I’ve incorporated the following configuration in the settings.json file to ensure that VSCode recognises them automatically:
1//  to automatically recognises virtualenv interpreters without starting code from an activated shell
2  "python.venvFolders": [
3    "~/Library/Caches/pypoetry/virtualenvs"
4  ],
5// to manually specify a default interpreter that will be used when you first open your workspace
6  "python.defaultInterpreterPath": "${env:PROJ_VENV}/bin/python"
However, the variable viewer in VSCode lacks the intuitive and detailed interface of PyCharm. Additionally, it struggles to handle complex nested objects with slots efficiently. On a positive note, the recent introduction of refactoring features in VSCode is a step in the right direction. Unlike PyCharm, these features are compatible with Jupyter Notebook, which is an important aspect to consider. Credit is due to the developers and contributors for providing this tool for free, given that VSCode is a community-driven, open-source project. With the momentum of progress within the VSCode community, I am confident that they will swiftly bridge the gaps.
As a side note, the progress of VSCode is certainly raising the bar for PyCharm. This is evident in the recently undertaken, albeit overdue, overhaul of the PyCharm UI and the addition of the integrated LightEdit mode in their product. This mode is particularly advantageous for users who value resource efficiency, especially when they are only viewing code or making simple adjustments.
Conclusion
Debugging is an essential skill for any code developer, aiding in understanding and improving code. PyCharm and VSCode are popular IDEs for Python development, each with its advantages and disadvantages. PyCharm offers a comprehensive and user-friendly debugging experience but is resource-intensive and costly. VSCode provides a lightweight and cost-effective debugging experience but lacks some advanced features of PyCharm. Both IDEs can be used for different purposes, such as PyCharm for complex and large-scale projects and VSCode for simple and quick tasks.